![[Home]](/~megera/oddmuse/zen3.gif)
All examples below require:
create table gis_data();
select AddGeometryColumn('', 'gis_data','geom',-1,'LINESTRING',2);
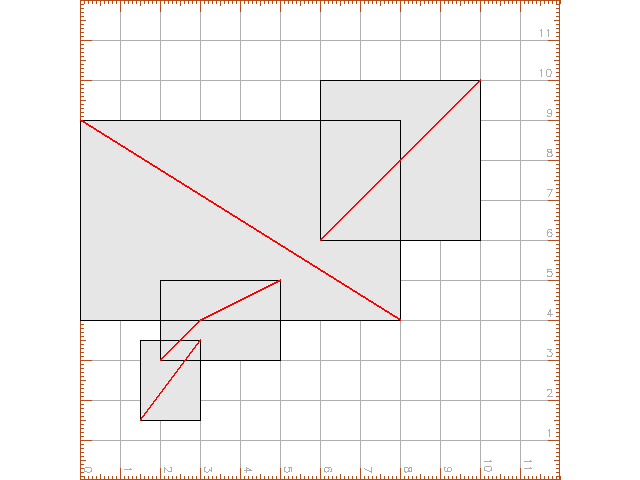
insert into gis_data(geom) values('LINESTRING(2 3,3 4,5 5)');
insert into gis_data(geom) values('LINESTRING(6 6,10 10)');
insert into gis_data(geom) values('LINESTRING(1.5 1.5,3 3.5)');
insert into gis_data(geom) values('LINESTRING(0 9,8 4)');
create index gix on gis_data using GIST (geom GIST_GEOMETRY_OPS);
select GeomFromText('POLYGON(('||xmin(a)::text||' '|| ymin(a)::text||','||xmin(a)::text||' '||ymax(a)::text||
','||xmax(a)::text||' '||ymax(a)::text||','||xmax(a)::text||' '||ymin(a)::text||','||xmin(a)::text||' '||
ymin(a)::text||'))') as geom into gist_sample
from (select a from gist_print('gix') as t(level int, valid bool, a box2d) where level =1) as foo;

testdb=> select asewkt(geom) from gist_sample;
                     asewkt
------------------------------------------------
 POLYGON((2 3,2 5,5 5,5 3,2 3))
 POLYGON((6 6,6 10,10 10,10 6,6 6))
 POLYGON((1.5 1.5,1.5 3.5,3 3.5,3 1.5,1.5 1.5))
 POLYGON((0 4,0 9,8 9,8 4,0 4))
(4 rows)
insert into geometry_columns values('','public','gist_sample','geom',2,-1,'POLYGON');
v.in.ogr -ceo dsn="PG:host=localhost dbname=testdb user=postgres" output=gis_data layer=gis_data
v.in.ogr -ceo dsn="PG:host=localhost dbname=testdb user=postgres" output=gist_sample layer=gist_sample
g.region vect=gist_sample
g.region n=12 e=12 s=0 w=0
d.mon x0
d.grid size=1 color=gray
d.vect gist_sample type=boundary,area fcolor=230:230:230
d.vect gis_data type=line color=red width=2
d.out.file output=gist_sample compression=1
g.remove vect=gist_sample,gis_data
drop table gis_data;
delete from geometry_columns where f_table_name='gis_data';
drop table gist_sample;
delete from geometry_columns where f_table_name='gist_sample';
# shp2pgsql -c -g geom test.shp public.gis_data | psql testdb

