Distribution of Supernovae according to their parent galaxies' recession velocity.
![]()
|
This graph shows the distribution of SNe according to the recession velocity of their parent galaxies. 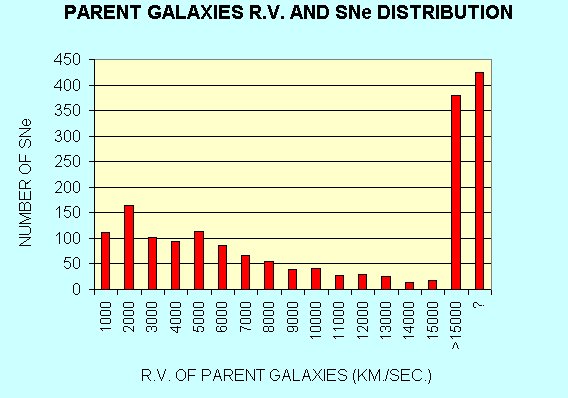
Along X-axis there are all velocity bands so that you have to read in this way: for example, the band on the graph marked as 2000 takes in all parent galaxies' recession velocities faster than 1000 until 2000 Km/sec. | ||