Supernovae distribution according to their magnitudes.
![]()
|
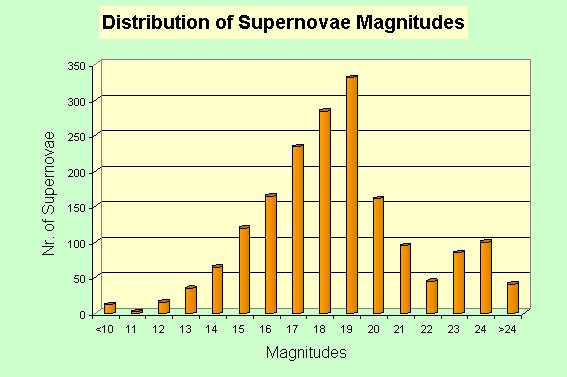
Along X-axis there are all magnitudes bands so that you have to read in this way: for example, the band on the graph marked as 18 takes in all supernovae between mag.17 and 18, or if one prefers ...until less than mag. 18, and so on... | ||